Attach Debugger
This page covers debugging for CPython (debugpy) and .NET attach (C# .csx, F# .fsx, compiled .dll). IronPython has no debugger attach in RevitDevTool.
Quick Reference
| Runtime | Attach method | Notes |
|---|---|---|
CPython *script.py | debugpy on localhost (default port 5678) | Attach before running the script |
IronPython *_ipy_script.py | Not supported | Use print tracing or migrate to CPython for breakpoints |
C# *script.csx | Attach to host process | Debug + portable PDB binds to original .csx |
F# *script.fsx | Attach to host process | FSI --debug+ maps back to original .fsx |
.NET .dll | Attach to host process | Standard compiled command debugging |
CPython — debugpy
Python debugging lets you attach VSCode (or any debugpy client) to a Python script running inside RevitDevTool. Use it when print debugging is too slow or when a bug only appears with real host API objects.
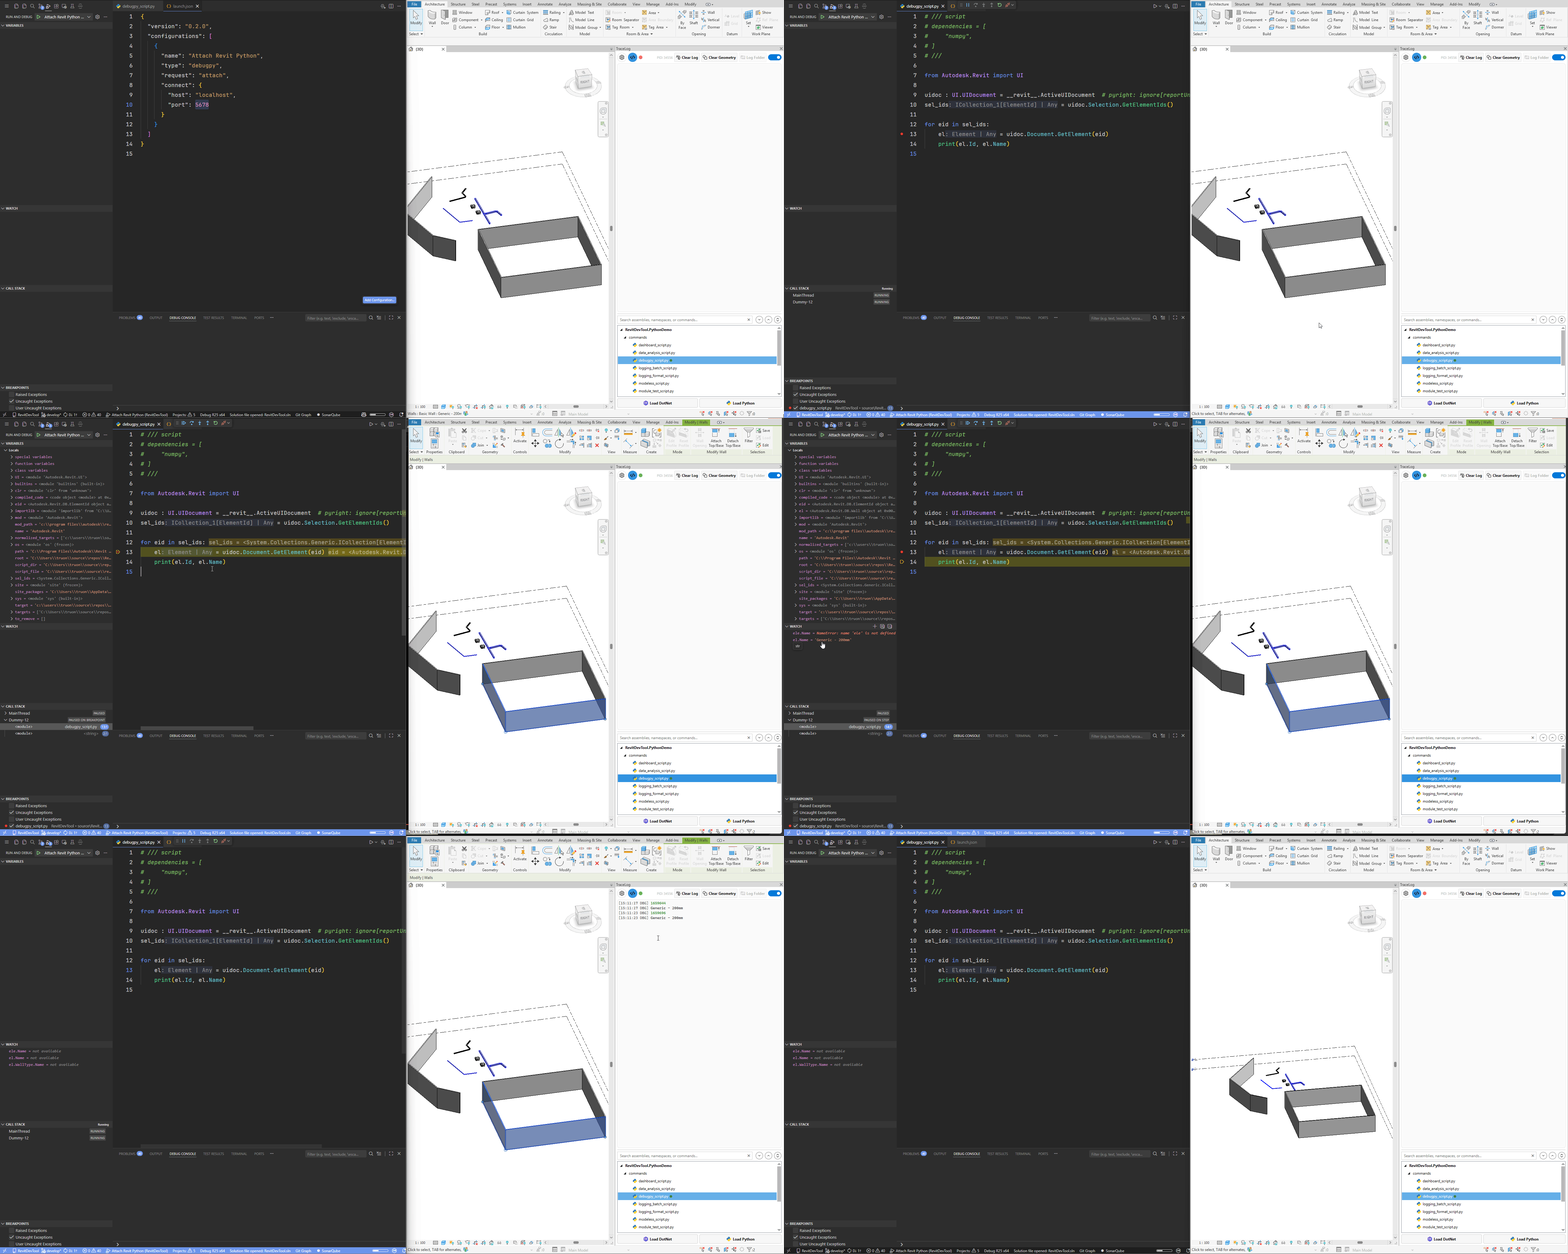
Quick Start
- Open the host with RevitDevTool loaded.
- Open your script folder in VSCode.
- Add a VSCode debug attach configuration.
- Set breakpoints in your Python script.
- Start the VSCode debugger.
- Run the script from RevitDevTool.
- Inspect variables when execution pauses.
RevitDevTool starts debugpy.listen during Python initialization. The default port is 5678; if that port is busy, an alternate localhost port is chosen automatically. Match the port shown in the RevitDevTool panel.
VSCode Launch Configuration
Create or update .vscode/launch.json:
{
  "version": "0.2.0",
  "configurations": [
    {
      "name": "Attach RevitDevTool Python",
      "type": "debugpy",
      "request": "attach",
      "connect": {
        "host": "localhost",
        "port": 5678
      },
      "justMyCode": false
    }
  ]
}
The port must match the debug port configured in RevitDevTool.
Sample Script
You can also debug normal scripts such as:
Debugging A Revit Collector
from Autodesk.Revit import DB

doc = __revit__.ActiveUIDocument.Document
walls = DB.FilteredElementCollector(doc).OfClass(DB.Wall).ToElements()

for wall in walls:
    curve = wall.Location.Curve
    length = curve.Length
    print(f"Wall {wall.Id}: {length:.2f}")
Useful breakpoints:
- before
FilteredElementCollector; - inside the wall loop;
- before calculations using geometry or parameters.
Useful values to inspect:
doc.Title;len(walls);wall.Id;wall.Name;wall.Location;curve.Length;- parameters returned by
wall.get_Parameter(...).
Debugging Patterns
Element Collection
Pause after a collector runs and inspect the count before processing the elements.
elements = DB.FilteredElementCollector(doc).OfClass(DB.FamilyInstance).ToElements()
print(f"Found {len(elements)} instances")
Parameter Access
Pause after retrieving a parameter so you can check whether it exists before calling AsString(), AsDouble(), or AsInteger().
param = wall.get_Parameter(DB.BuiltInParameter.WALL_USER_HEIGHT_PARAM)
height = param.AsDouble() if param else 0
Selection
Use breakpoints after user selection to inspect the selected reference and element.
ref = uidoc.Selection.PickObject(UI.Selection.ObjectType.Element)
element = doc.GetElement(ref)
CPython Common Problems
| Symptom | Check |
|---|---|
| Breakpoint is never hit | VSCode is attached before running the script |
| VSCode cannot connect | debug port matches RevitDevTool settings |
debugpy import fails | Python dependencies were prepared successfully |
| Debugger attaches but file is not mapped | open the same script folder in VSCode |
| Script blocks waiting | a modal host selection/dialog may be active |
| Host freezes while paused | this is expected; continue/step from VSCode |
IronPython — No Attach
IronPython scripts (*_ipy_script.py) do not support debugger attach in RevitDevTool. There is no debugpy bridge and no host attach hook for IronPython execution.
If you need VSCode breakpoints, use CPython *script.py instead. If you need to stay on IronPython, use print tracing or run under pyRevit's own tooling.
On Revit, IronPython execution prefers the pyRevit engine (default IronPython 2.7.12); AutoCAD-family hosts use bundled IronPython 3.4.2.
.NET Attach — C# Scripts, F# Scripts, Assemblies
C# .csx, F# .fsx, and compiled .dll commands all run inside the host process. Attach your .NET debugger to that process — not to a separate debug port.
Visual Studio
- Build or open the script/assembly project (or open the script folder).
- Set breakpoints in
.csx,.fsx, or your compiled source. - Start the host (
Revit.exe,acad.exe, …) with RevitDevTool loaded. - Debug → Attach to Process… and select the host.
- Run the command from RevitDevTool.
For C# scripts, Roslyn emits Debug + portable PDB so breakpoints bind to the original .csx on disk. For F# scripts, FSI runs with --debug+ and #line mapping back to your .fsx files.
VS Code (C# Dev Kit)
- Open the script or project folder.
- Set breakpoints.
- Use Run and Debug → Attach to Process and pick the host PID.
- Run the command from RevitDevTool.
Ionide can edit F# scripts; attach still targets the host process the same way.
Placeholder Screenshots

Placeholder — replace with a product screenshot.

Placeholder — replace with a product screenshot.

Placeholder — replace with a product screenshot.
.NET Attach Tips
- Attach before running the command when you need to break on startup logic.
- Keep script sources on disk at the paths used when the script was compiled — PDB and
#linemapping depend on those paths. - On Revit 2022–2024 (.NET Framework), assembly loading differs from Revit 2025+ (collectible ALC). Breakpoints still work; unloading behavior differs — see .NET Assembly.
- While paused at a breakpoint, the host UI is frozen until you continue — same as CPython
debugpy.