Example: BIM Dashboard with WebView2
Demo: Production-grade dashboard with React + TypeScript UI
Script: dashboard_script.py
Time: 5-10 minutes (first run with dependency installation)
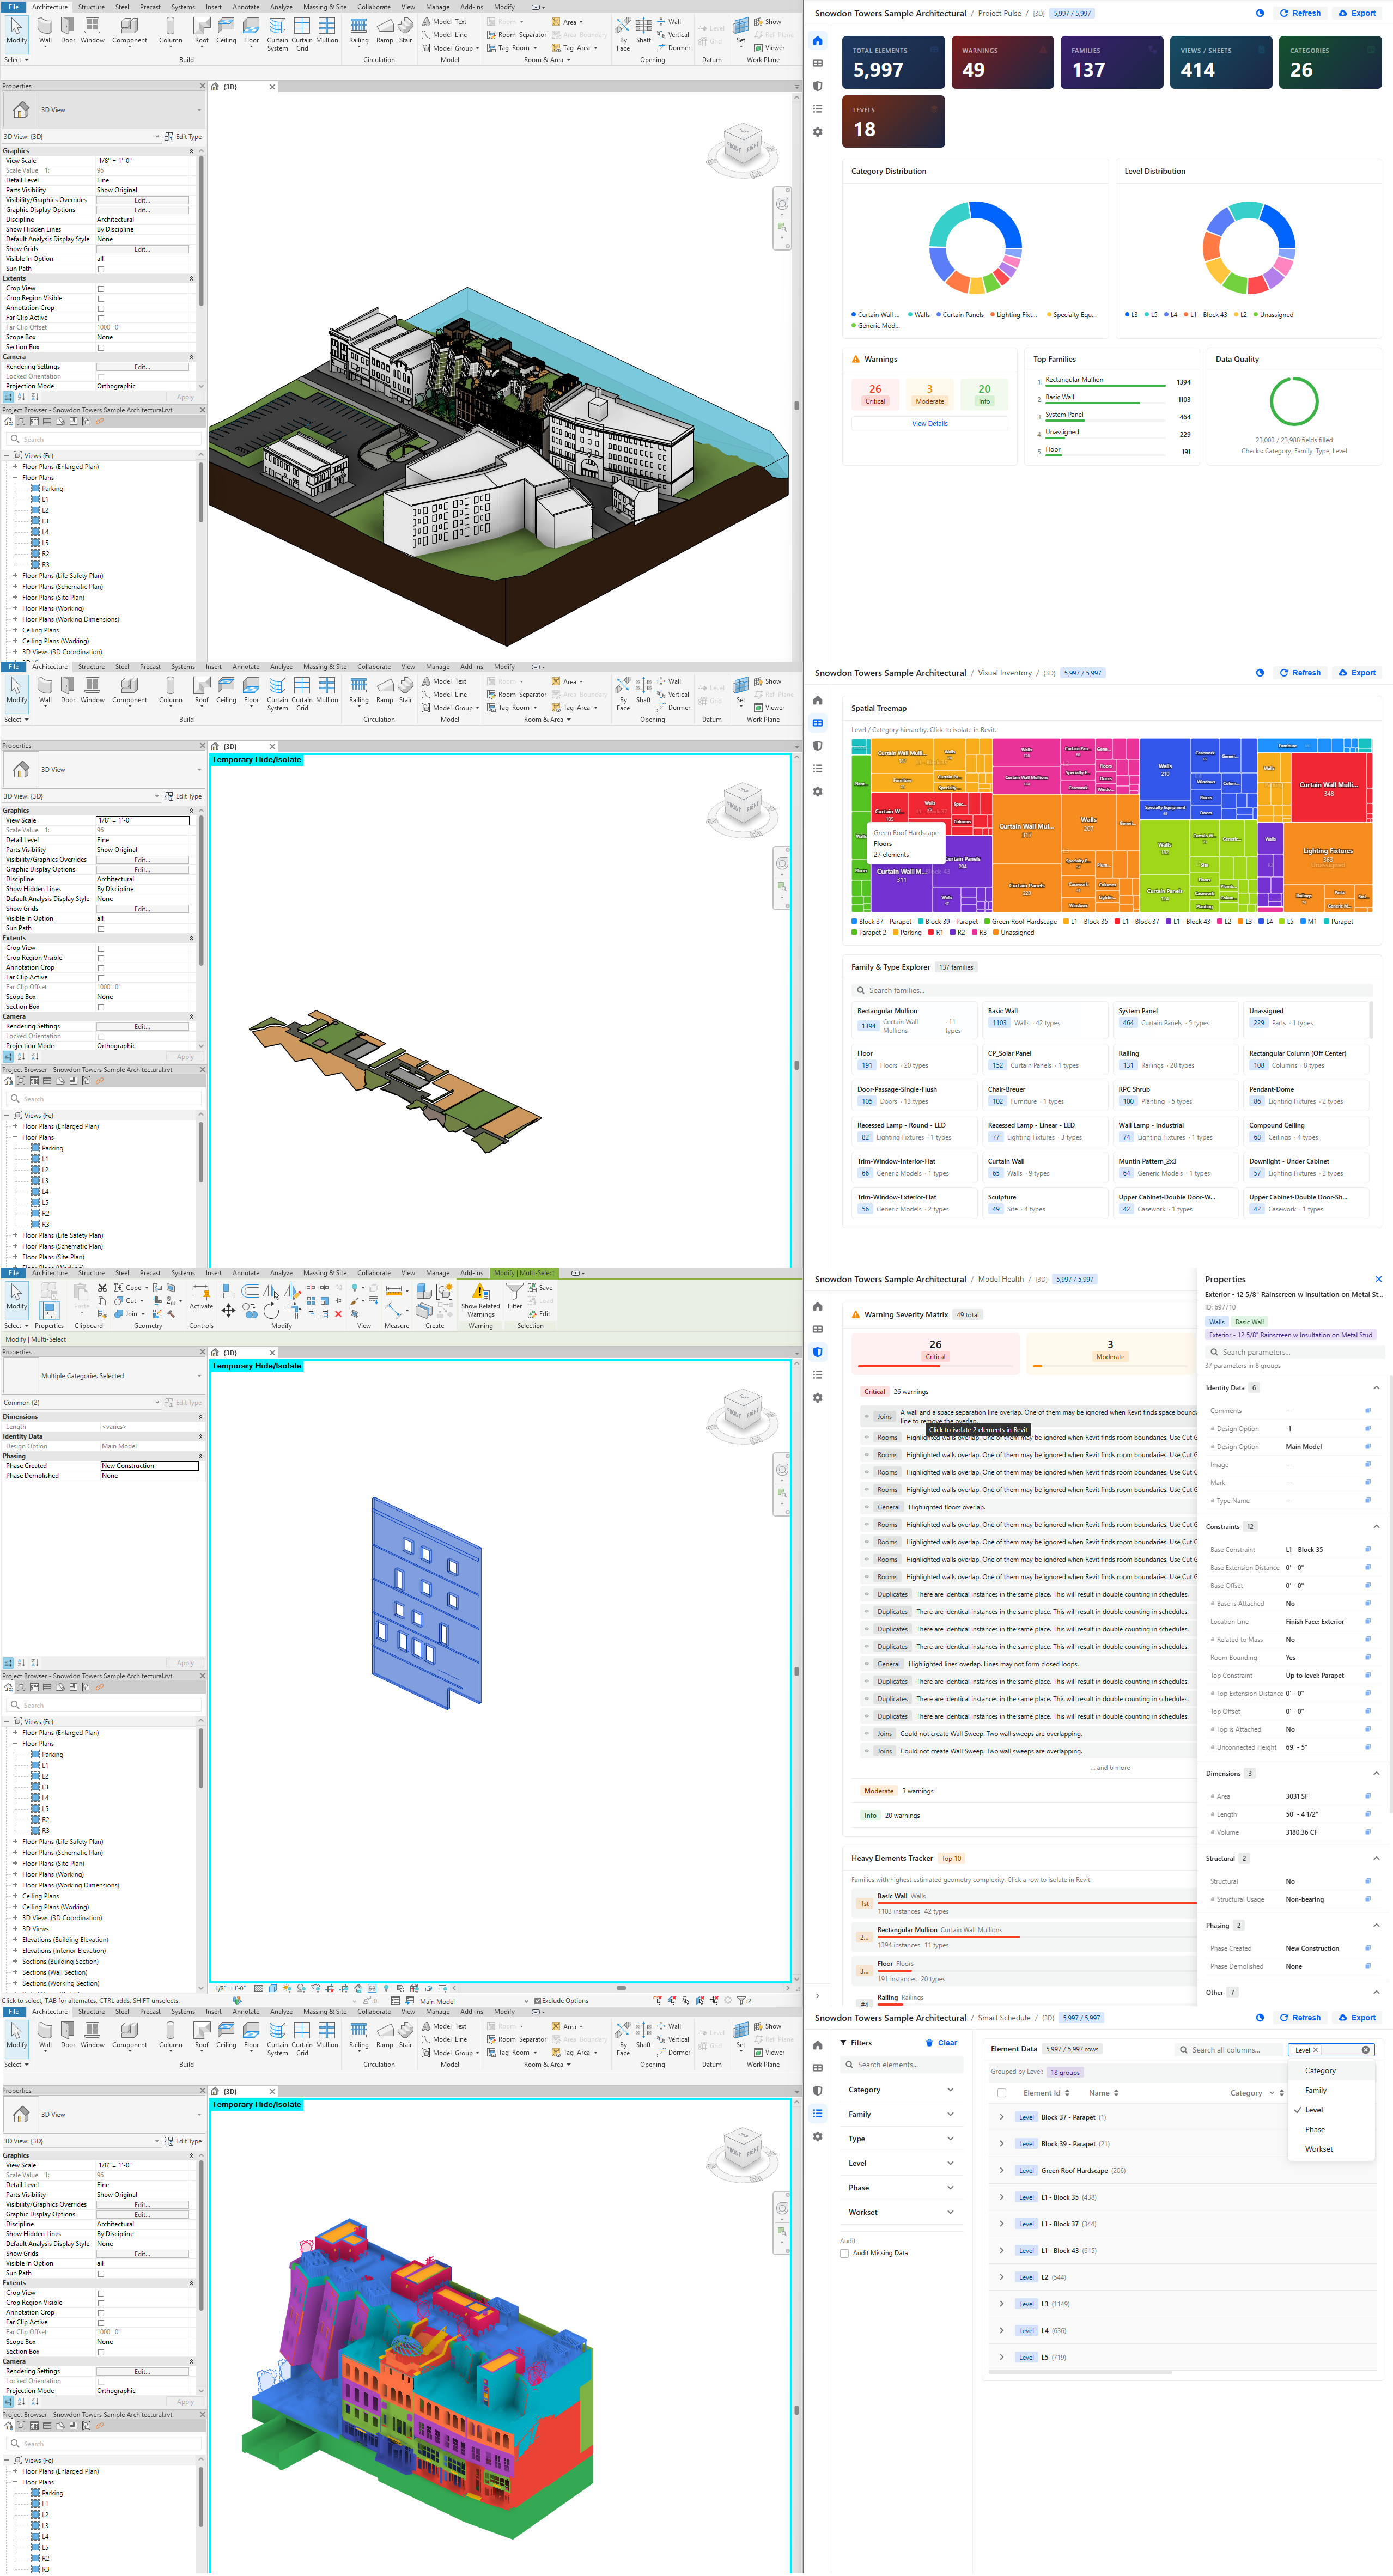
What It Demonstrates
- Modern web stack - React 19 + TypeScript + TailwindCSS v4 + Semi Design
- WebView2 integration - Embedded browser UI in Revit
- Revit data collection - Elements, warnings, heavy families
- Real-time analytics - Polars + NumPy data processing
- Bidirectional communication - Python ↔ JavaScript bridge
- Excel export - OpenPyXL with formatted worksheets
- Hot reload development - Vite dev server for rapid iteration
Architecture Overview
dashboard_script.py (Entry Point)
    ↓
revit_dashboard/runner.py (Orchestrator)
    ↓
├─ data/
│  ├─ collector.py          ← Revit API data extraction
│  ├─ warnings.py           ← Model warnings
│  ├─ heavy_families.py     ← Performance analysis
│  └─ categories.py         ← Category statistics
├─ analytics/
│  └─ engine.py             ← Polars/NumPy analytics
├─ presentation/
│  ├─ webview_host.py       ← WebView2 window
│  └─ bridge.py             ← MessageRouter (Python ↔ JS)
├─ revit_api/
│  └─ handler.py            ← Revit API actions (selection, zoom, etc.)
├─ export/
│  └─ excel_exporter.py     ← Excel generation
└─ core/
   └─ event_queue.py        ← RevitActionDispatcher (thread-safe)

revit_dashboard_ui/ (Frontend - React + TypeScript)
    ↓
├─ src/
│  ├─ pages/                ← Multi-page app (home, health, inventory, schedule, settings)
│  ├─ features/             ← Feature modules (charts, filters, tables)
│  ├─ components/           ← Reusable UI components (shadcn/ui)
│  ├─ providers/            ← React context (bridge, dashboard state)
│  └─ lib/
│     ├─ bridge-client.ts   ← JavaScript bridge client
│     └─ mock-data.ts       ← Mock data for browser development
└─ dist/                    ← Built production files
Entry Point Pattern
# dashboard_script.py
# /// script
# dependencies = [
#     "polars==1.38.1",
#     "numpy==2.4.2",
#     "openpyxl==3.1.5",
# ]
# ///

from revit_dashboard.runner import main

if __name__ == "__main__":
    main()
What happens:
- RevitDevTool prepares dependencies (first run only)
- Imports orchestrator from
revit_dashboardpackage - Launches dashboard workflow
Data Collection Pattern
# revit_dashboard/data/collector.py
def collect_model_elements(doc):
    """Extract all elements with properties."""
    collector = FilteredElementCollector(doc)
    elements = []

    for el in collector.WhereElementIsNotElementType():
        try:
            elements.append({
                "id": el.Id.IntegerValue,
                "name": el.Name or "Unnamed",
                "category": el.Category.Name if el.Category else "Unknown",
                "level": get_level_name(el),
                "family": get_family_name(el),
                "type": get_type_name(el),
                # ... more properties
            })
        except:
            continue

    return elements
Processing:
- Scans entire model (~2-5 seconds for large projects)
- Extracts properties safely (handles exceptions)
- Returns list of dictionaries for analytics
Analytics Pattern
# revit_dashboard/analytics/engine.py
import polars as pl
import numpy as np

def build_dashboard_payload(rows, filters, model_info, warnings, heavy_families):
    """Transform raw data into analytics payload."""

    # Convert to Polars DataFrame for fast analytics
    df = pl.DataFrame(rows)

    # Apply filters if provided
    if filters:
        df = apply_filters(df, filters)

    # Compute statistics
    category_counts = df.group_by("category").count()
    family_distribution = df.group_by("family").count()
    level_breakdown = df.group_by("level").count()

    # Build payload for frontend
    return {
        "model_info": model_info,
        "rows": df.to_dicts(),  # For table display
        "stats": {
            "total_elements": len(df),
            "categories": len(category_counts),
            "families": len(family_distribution),
        },
        "charts": {
            "category_counts": category_counts.to_dicts(),
            "family_distribution": family_distribution.to_dicts(),
        },
        "warnings": warnings,
        "heavy_families": heavy_families,
    }
Features:
- Polars for fast DataFrame operations
- NumPy for numerical computations
- Flexible filtering system
- Structured payload for frontend
WebView2 Integration Pattern
# revit_dashboard/presentation/webview_host.py
import json
from System.Windows.Forms import WebBrowser

DEV_MODE = False  # Set to True for hot reload development

def show_dashboard(payload, handler_factory):
    """Launch WebView2 window with React app."""

    if DEV_MODE:
        # Development: Connect to Vite dev server (hot reload)
        url = "http://localhost:5173"
    else:
        # Production: Load built files from dist/
        html_path = get_dist_index_html()
        url = f"file:///{html_path}"

    # Create window with bridge
    window = WebViewWindow(url)

    # Inject payload when ready
    def on_ready():
        window.inject_payload(payload)

    # Setup message handlers
    router = MessageRouter(window)
    dispatcher = RevitActionDispatcher()
    handlers = handler_factory(router, dispatcher)

    for event_type, handler in handlers.items():
        router.on(event_type, handler)

    window.show()
Development modes:
- Browser mode -
npm run dev→ Mock data for UI development - Revit dev mode -
DEV_MODE = True→ Hot reload with real data - Production mode -
DEV_MODE = False→ Built files fromdist/
Bridge Communication Pattern
Python → JavaScript
# revit_dashboard/presentation/bridge.py
class MessageRouter:
    def emit(self, event_type, payload):
        """Send message to JavaScript."""
        message = json.dumps({
            "type": event_type,
            "payload": payload
        })
        self.window.execute_script(f"window.handlePythonMessage({message})")
JavaScript → Python
// revit_dashboard_ui/src/lib/bridge-client.ts
export class BridgeClient {
  send(type: string, payload: any) {
    // Send to Python via WebView2 bridge
    window.chrome.webview.postMessage({
      type,
      payload
    });
  }

  on(type: string, handler: (payload: any) => void) {
    // Receive from Python
    window.addEventListener('message', (event) => {
      if (event.data.type === type) {
        handler(event.data.payload);
      }
    });
  }
}
Example: Export Flow
// Frontend: User clicks export button
bridge.send('export_excel', {
  filters: currentFilters
});

// Backend: Handle export
def handle_export(message):
    filters = message.get('payload', {}).get('filters', {})
    path = export_filtered_rows_to_excel(rows, filters)
    router.emit('bim-export-result', {
        'ok': True,
        'path': path
    })

// Frontend: Show success notification
bridge.on('bim-export-result', (result) => {
  if (result.ok) {
    toast.success(`Exported to ${result.path}`);
  }
});
Revit API Actions Pattern
# revit_dashboard/revit_api/handler.py
class RevitApiHandler:
    def handle(self, method, params):
        """Execute Revit API actions (thread-safe)."""

        if method == "select_elements":
            element_ids = params.get("ids", [])
            self._select_in_revit(element_ids)
            return {"ok": True}

        elif method == "zoom_to_elements":
            element_ids = params.get("ids", [])
            self._zoom_to_elements(element_ids)
            return {"ok": True}

        elif method == "refresh_data":
            # Re-collect from Revit
            payload = self.refresh_callback()
            return {"ok": True, "payload": payload}
Thread safety:
- Uses
RevitActionDispatcherto queue actions - Executes on Revit's main thread via
ExternalEvent - Returns results asynchronously to frontend
Frontend Architecture
Multi-Page App
// revit_dashboard_ui/src/App.tsx
<Routes>
  <Route path="/" element={<HomePage />} />
  <Route path="/health" element={<HealthPage />} />
  <Route path="/inventory" element={<InventoryPage />} />
  <Route path="/schedule" element={<SchedulePage />} />
  <Route path="/settings" element={<SettingsPage />} />
</Routes>
State Management
// revit_dashboard_ui/src/providers/dashboard-provider.tsx
export function DashboardProvider({ children }) {
  const [payload, setPayload] = useState<Payload | null>(null);
  const [filters, setFilters] = useState<Filters>({});
  const [selection, setSelection] = useState<number[]>([]);

  // Auto-sync with Python backend
  useEffect(() => {
    bridge.on('payload-update', setPayload);
  }, []);

  return (
    <DashboardContext.Provider value={{
      payload, filters, selection,
      setFilters, setSelection
    }}>
      {children}
    </DashboardContext.Provider>
  );
}
Components
- Semi Design - Enterprise-grade UI component library (
@douyinfe/semi-ui) - Radix UI - Headless UI primitives for custom components
- TanStack Table - Virtualized table (handles 10k+ rows)
- Recharts - Interactive charts
- Sonner - Toast notifications
Features
1. Home Page
- Project overview metrics
- Category distribution charts
- Quick stats (elements, families, warnings)
2. Health Page
- Model warnings matrix
- Heavy families tracker
- Performance recommendations
3. Inventory Page
- Family explorer with tree view
- Instance count by family
- Type distribution
4. Schedule Page
- Filterable data table (virtualized)
- Export to Excel
- Column sorting and filtering
5. Settings Page
- Filter configuration
- Display preferences
- Export options
Try It Yourself
Quick Start (Production Mode)
Use pre-built UI - no setup required:
- Load folder:
samples/PythonDemo/commands/ - Execute
dashboard_script.py - Wait for data collection (~2-5 seconds)
- Explore multi-page dashboard
- Click export to generate Excel
The dashboard uses pre-built files from revit_dashboard_ui/dist/ - no Node.js or npm installation needed.
Development Mode (Hot Reload)
For UI development with live updates:
Prerequisites
- Install Node.js
- Download from nodejs.org (LTS version recommended)
- Verify installation:
node --version # Should show v20.x or highernpm --version # Should show v10.x or higher
Setup Steps
-
Navigate to frontend folder:
cd samples/PythonDemo/revit_dashboard_ui -
Install dependencies:
npm installThis installs all required packages (~5 minutes first time):
- React 19, TypeScript
- Semi Design, Radix UI
- TailwindCSS v4, Vite
- TanStack Table, Recharts, etc.
-
Start dev server:
npm run devYou should see:
VITE v7.3.1 ready in 1234 ms➜ Local: http://localhost:5173/➜ Network: use --host to expose -
Enable dev mode in Python:
Edit
revit_dashboard/presentation/webview_host.py:DEV_MODE = True # Change from False to True -
Run dashboard from Revit:
- Execute
dashboard_script.pyin RevitDevTool - Dashboard will connect to
http://localhost:5173 - Any changes to React code will hot reload instantly
- Execute
Development Workflow
Edit React code → Save → Browser auto-refreshes → See changes immediately
No need to rebuild or restart Revit!
Build for Production
When ready to deploy:
npm run build
This creates optimized files in dist/ folder. Set DEV_MODE = False to use them.
Troubleshooting
"npm: command not found"
- Install Node.js from nodejs.org
- Restart terminal after installation
"Port 5173 already in use"
- Stop other Vite dev servers
- Or change port in
vite.config.ts
"Module not found" errors
- Run
npm installagain - Delete
node_modules/andpackage-lock.json, thennpm install
Dashboard shows blank page
- Check dev server is running (
npm run dev) - Verify
DEV_MODE = Trueinwebview_host.py - Check browser console for errors (F12)
Full source:
- Python:
dashboard_script.py - Frontend:
revit_dashboard_ui/
Project Structure
RevitDevTool.PythonDemo/
├── commands/
│   └── dashboard_script.py              ← Entry point (PEP 723)
│
├── revit_dashboard/                     ← Python backend
│   ├── runner.py                        ← Main orchestrator
│   ├── context.py                       ← HOST_APP singleton
│   ├── constants.py                     ← Configuration
│   ├── data/
│   │   ├── collector.py                 ← Element collection
│   │   ├── warnings.py                  ← Warning extraction
│   │   ├── heavy_families.py            ← Performance analysis
│   │   └── categories.py                ← Category stats
│   ├── analytics/
│   │   └── engine.py                    ← Polars/NumPy analytics
│   ├── presentation/
│   │   ├── webview_host.py              ← WebView2 window
│   │   └── bridge.py                    ← MessageRouter
│   ├── revit_api/
│   │   └── handler.py                   ← Revit API actions
│   ├── export/
│   │   └── excel_exporter.py            ← Excel generation
│   ├── core/
│   │   └── event_queue.py               ← RevitActionDispatcher
│   └── contracts/
│       └── payload.py                   ← Type definitions
│
└── revit_dashboard_ui/                  ← React frontend
    ├── src/
    │   ├── App.tsx                      ← Main app component
    │   ├── pages/                       ← Page components
    │   │   ├── home-page.tsx
    │   │   ├── health-page.tsx
    │   │   ├── inventory-page.tsx
    │   │   ├── schedule-page.tsx
    │   │   └── settings-page.tsx
    │   ├── features/                    ← Feature modules
    │   │   ├── home/
    │   │   ├── health/
    │   │   ├── inventory/
    │   │   └── filters/
    │   ├── components/                  ← Reusable components
    │   │   ├── ui/                      ← Custom components (Radix UI primitives)
    │   │   ├── charts/                  ← Chart components (Recharts)
    │   │   └── layout/                  ← Layout components (Semi Design)
    │   ├── providers/                   ← React contexts
    │   │   ├── bridge-provider.tsx
    │   │   └── dashboard-provider.tsx
    │   ├── hooks/                       ← Custom hooks
    │   ├── lib/                         ← Utilities
    │   │   ├── bridge-client.ts         ← Bridge client
    │   │   └── mock-data.ts             ← Mock data generator
    │   └── types/                       ← TypeScript types
    ├── dist/                            ← Built production files
    ├── package.json                     ← npm dependencies
    ├── vite.config.ts                   ← Vite configuration
    └── tailwind.config.js               ← TailwindCSS config
Tech Stack
Python Backend
- Polars - Fast DataFrame operations
- NumPy - Numerical computations
- OpenPyXL - Excel generation
- Revit API - Data extraction
JavaScript Frontend
- React 19 - UI framework
- TypeScript - Type safety
- Vite - Build tool with hot reload
- TailwindCSS v4 - Styling
- Semi Design - Enterprise UI component library
- Radix UI - Headless UI primitives
- TanStack Table - Virtualized tables
- Recharts - Charts
- Sonner - Notifications
Related Examples
- Data analysis →
data_analysis_script.py - Logging →
logging_format_script.py - Visualization →
visualization_curve_script.py